

First question...
Why are inbound marketing analytics important?
Successful inbound marketers don’t make decisions based on feelings.
They make their decisions based on data.
Where does that data come from?
Why, their marketing analytics, of course!
That is what you will use to prove the ROI of your inbound marketing.
Here's how to use marketing analytics to improve each channel’s marketing performance, starting with landing pages, SEO, and business blogging to social media, email marketing, and lead nurturing.
However, you'll want to rely on data from closed-loop marketing analytics.
So...
Let's address why that's so important.
With closed-loop marketing data, you can track a lead from the moment of first conversion on your website, until that lead becomes your customer.
With this information you can look back to see which marketing channels are most effective at generating customers at the lowest cost.
That will be the next key in proving the ROI of your inbound marketing.
Now...
This post is over 6,000 words if you don't have time to read the whole thing, email it to yourself or bookmark it for later, or jump to the section that interests you most.
![]()
Chapters
Chapter 1
Improving Landing Pages with Marketing Analytics
These are the metrics that you will need to track to prove the ROI of your landing pages...
Call-to-Action Click-Through Rate: The percentage of visitors who visit your landing page from your call-to-action
Visitor-to-Lead Conversion Rate: The percentage of visitors who become leads
Lead-to-Customer Conversion Rate: The percentage of leads who become customers
Visit-to-Customer Conversion Rate: The percentage of visitors who become customers
Call-to-Action Click-Through Rate
Before you can even look at how well your landing page converts visitors to leads and customers, you should analyze the performance of that page's call-to-action.
Is it actually driving visitors to click and stay on your landing page long enough to convert?
Here's what you'll want to do...
Begin by establishing a baseline metric of your CTA click-through rate, taking the average rate of all your CTAs will be a good start.
The landing pages with the lowest CTA click-through rate should be the first you set out to improve.
CTA's with a low click-through rate are most likely suffering from one or more of the following:
- It's not standing out
- The copy is unclear
- It's out of context
Collecting Call-to-Action Insights
In order to optimize your calls-to-action, you need to monitor their performance and figure out what to improve.
In addition to click-through rates, you should also be tracking views to submission, a metric that will give you a deeper knowledge of how your calls-to-action affect lead generation.
Your views-to-submission rate tells you how many visitors saw your CTA, clicked the CTA, and then filled out the form on the landing page.
Views-to-Submissions will be a good indicator of the message match between your CTA and your landing page.
Message Match
Here's a quick test to see if your call-to-action and landing page are aligned...
Does the language in the call-to-action that describes the offer and its subject matter also appear on your landing page?
If not, then that's a problem.
The textbook definition of message match is this...
"A measure of how well your landing page copy matches the phrasing of the ad or link that brought the visitor there."
Once you ensure the language matches, make sure it is easily visible so your landing page passes a five second test.
The five second test refers to the commonly accepted five seconds you have to orient a visitor on your landing page once they are there.
If a visitor comes to your landing page and can’t figure out what to do on that page, they will click the back button immediately.
To prevent that from happening you need to reinforce the language of the call-to-action.
You'll want to include the language in a prominent position, but also where it makes the most sense.
Don't force it into every element of your landing page.
Provide each of these above the fold, your options are using it in the beginning of your landing page headline, within the copy on your landing page, on your form’s title, and in the form’s button.
To conduct your own five second test, I would strongly recommend a tool like UsabilityHub.
With UsabilityHub, you'll be able to upload a screenshot or a mock-up and get responses from real people in the demographic of your choice.
You can ask them whatever questions you'd like, but keep in mind they only get to see your page for 5 seconds.
So...
I'd ask a question like the one below.
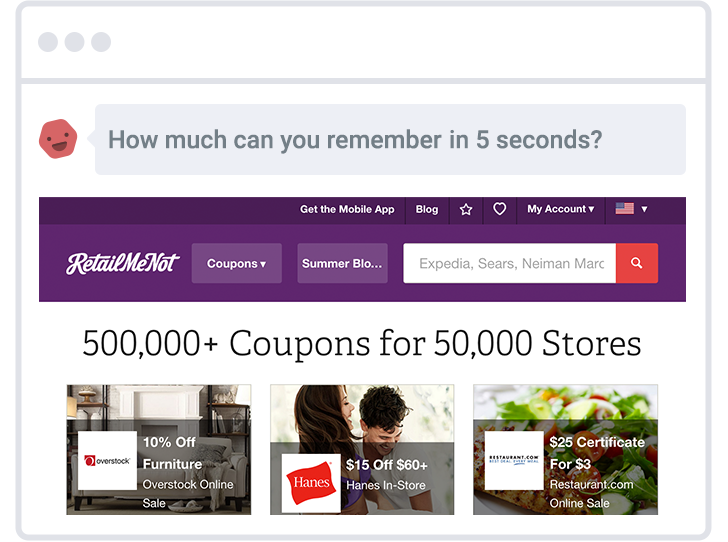
From there you'll be able to see their responses in a list or a word cloud.
For the purposes of this test, I'd recommend looking at the word cloud, that will make it easy to tell if the words that resonated with the testers are the same as what's in your call-to-action.

Remove Navigation
One more way to prevent visitors from abandoning your landing page is removing the navigation and any other calls-to-action on the page.
If you include your site’s regular navigation at the top of your landing page or give visitors an opportunity to leave the page with competing calls-to-action, you increase the likelihood of a visitor leaving your landing page.
Remember the golden rule...
Every landing page has one goal and only one goal.
Also known as keeping your landing page's attention ratio 1:1.
Visitor-to-Lead Conversion Rate
You’ve got visitors staying on your landing page long enough to fill out your form.
Now what?
Let’s break down what your landing page conversion rates -- visitor to lead, lead to customer, and visitor to customer -- tell you about your marketing efforts, and how you should adjust your marketing based on these metrics.
Identify opportunities to improve landing page conversions by comparing the click-through rate of your call-to-action with the visitor-to-lead conversion rate of your landing page.
There is some research that shows companies with 30 or more landing pages generate seven times more leads than those with fewer than 10.
However...
I can guarantee you not all of those landing pages have the same conversion rate and that not all landing pages are created equal.
Take a quick audit of your landing pages.
See which of landing pages have the highest conversion rate and see which have the highest number of visits.
Do they line up?
My guess is probably not.
For now what you'll want to do is keep a list of those pages, you can do it in Excel, Google Sheets, Notes, etc.
The key here is going to be two-fold...
First, note the content topic, whether it's about content marketing, baby strollers, furnace replacement, etc.
Second, note the content format, whether it's a white paper, webinar, demo, tool, direct contact, etc.
Keep this list handy.
Optimize Visitor-to-Lead Through A/B Testing
If you have a high click-through on your call-to-action, but a low visitor-to-lead conversion rate, there is a problem with your landing page.
Maybe the problem is your call-to-action says "Free" and your landing page says "Not Really Free" or the form doesn't work.
Aside from a problem like that, you'll want to use A/B testing to improve your landing page.
Which is all part of taking a Growth Driven Design approach to your website.
The short version of A/B testing though is this...
A method of comparing two versions of a web page or app against each other to determine which one performs better.
A/B testing is essentially an experiment where two or more variants of a page are shown to users at random, and statistical analysis is used to determine which variation performs better for a given conversion goal.
If your visitor-to-lead conversion rate is high but the number of new leads that page generates is low, your problem lies with the traffic the landing page is generating.
Start by taking a look at your call-to-action’s conversion rate. If it is low, your problem lies in the call-to-action -- begin A/B testing its design and copy to help drive more traffic to your landing page.
When conducting A/B tests, set up your current version of your landing page or call-to-action as the “control”.
From there, build variations, or “treatment,” pages or call-to-actions you’ll test against your control.
For example, if you are wondering whether including a testimonial on a landing page would make a difference in conversions, set up your control page with no testimonials. Then create your variation(s).
- Variation A: Control (the unaltered, original version)
- Variation B: Treatment (the optimized version which you expect to perform better)
One very important note...
Depending on what A/B testing software you are using, do not do an A/B test on the call-to-action to a landing page that is also the subject of an A/B test.
If you do that in most circumstances it will be very difficult, if not impossible, to determine what impacted the conversion rate of the landing page.
Find Winning Content Offers
You'll want to refer back to your list with your top converting and most visited landing pages.
Is there a particular content asset type that converts more leads?
For example, you may find that webinars convert more visitors into leads than eBooks. Or perhaps it’s a particular content topic that performs better.
Did your content assets about unicorn hygiene have a higher visitor-to-lead conversion rate than your content assets about unicorn fashion?
If you know the content asset types and topics that generate a higher visitor-to-lead rate, you can focus your content creation efforts around them to generate more leads.
Lead-to-Customer Conversion Rate
You can’t stop your analysis at just the visitors-to-leads.
The next step is to analyze which leads actually turn into customers, using closed-loop analytics.
You'll need to look at two metrics...
- Which landing pages converted the most visitors and leads into customers?
- Which pages assisted the customer acquisition process?
Use that information to identify your most powerful offers, and silo your weakest.
If you know which landing pages generate the most customers, you can promote them more frequently.
Then spend less time focusing on the content that perhaps brings in visitors and leads at a high rate.
That takes care of the first metric, now the more complex one.
You can find which pages assisted with the customer acquisition process in Google Analytics, but let's take a look at how you can do it with a tool like HubSpot.
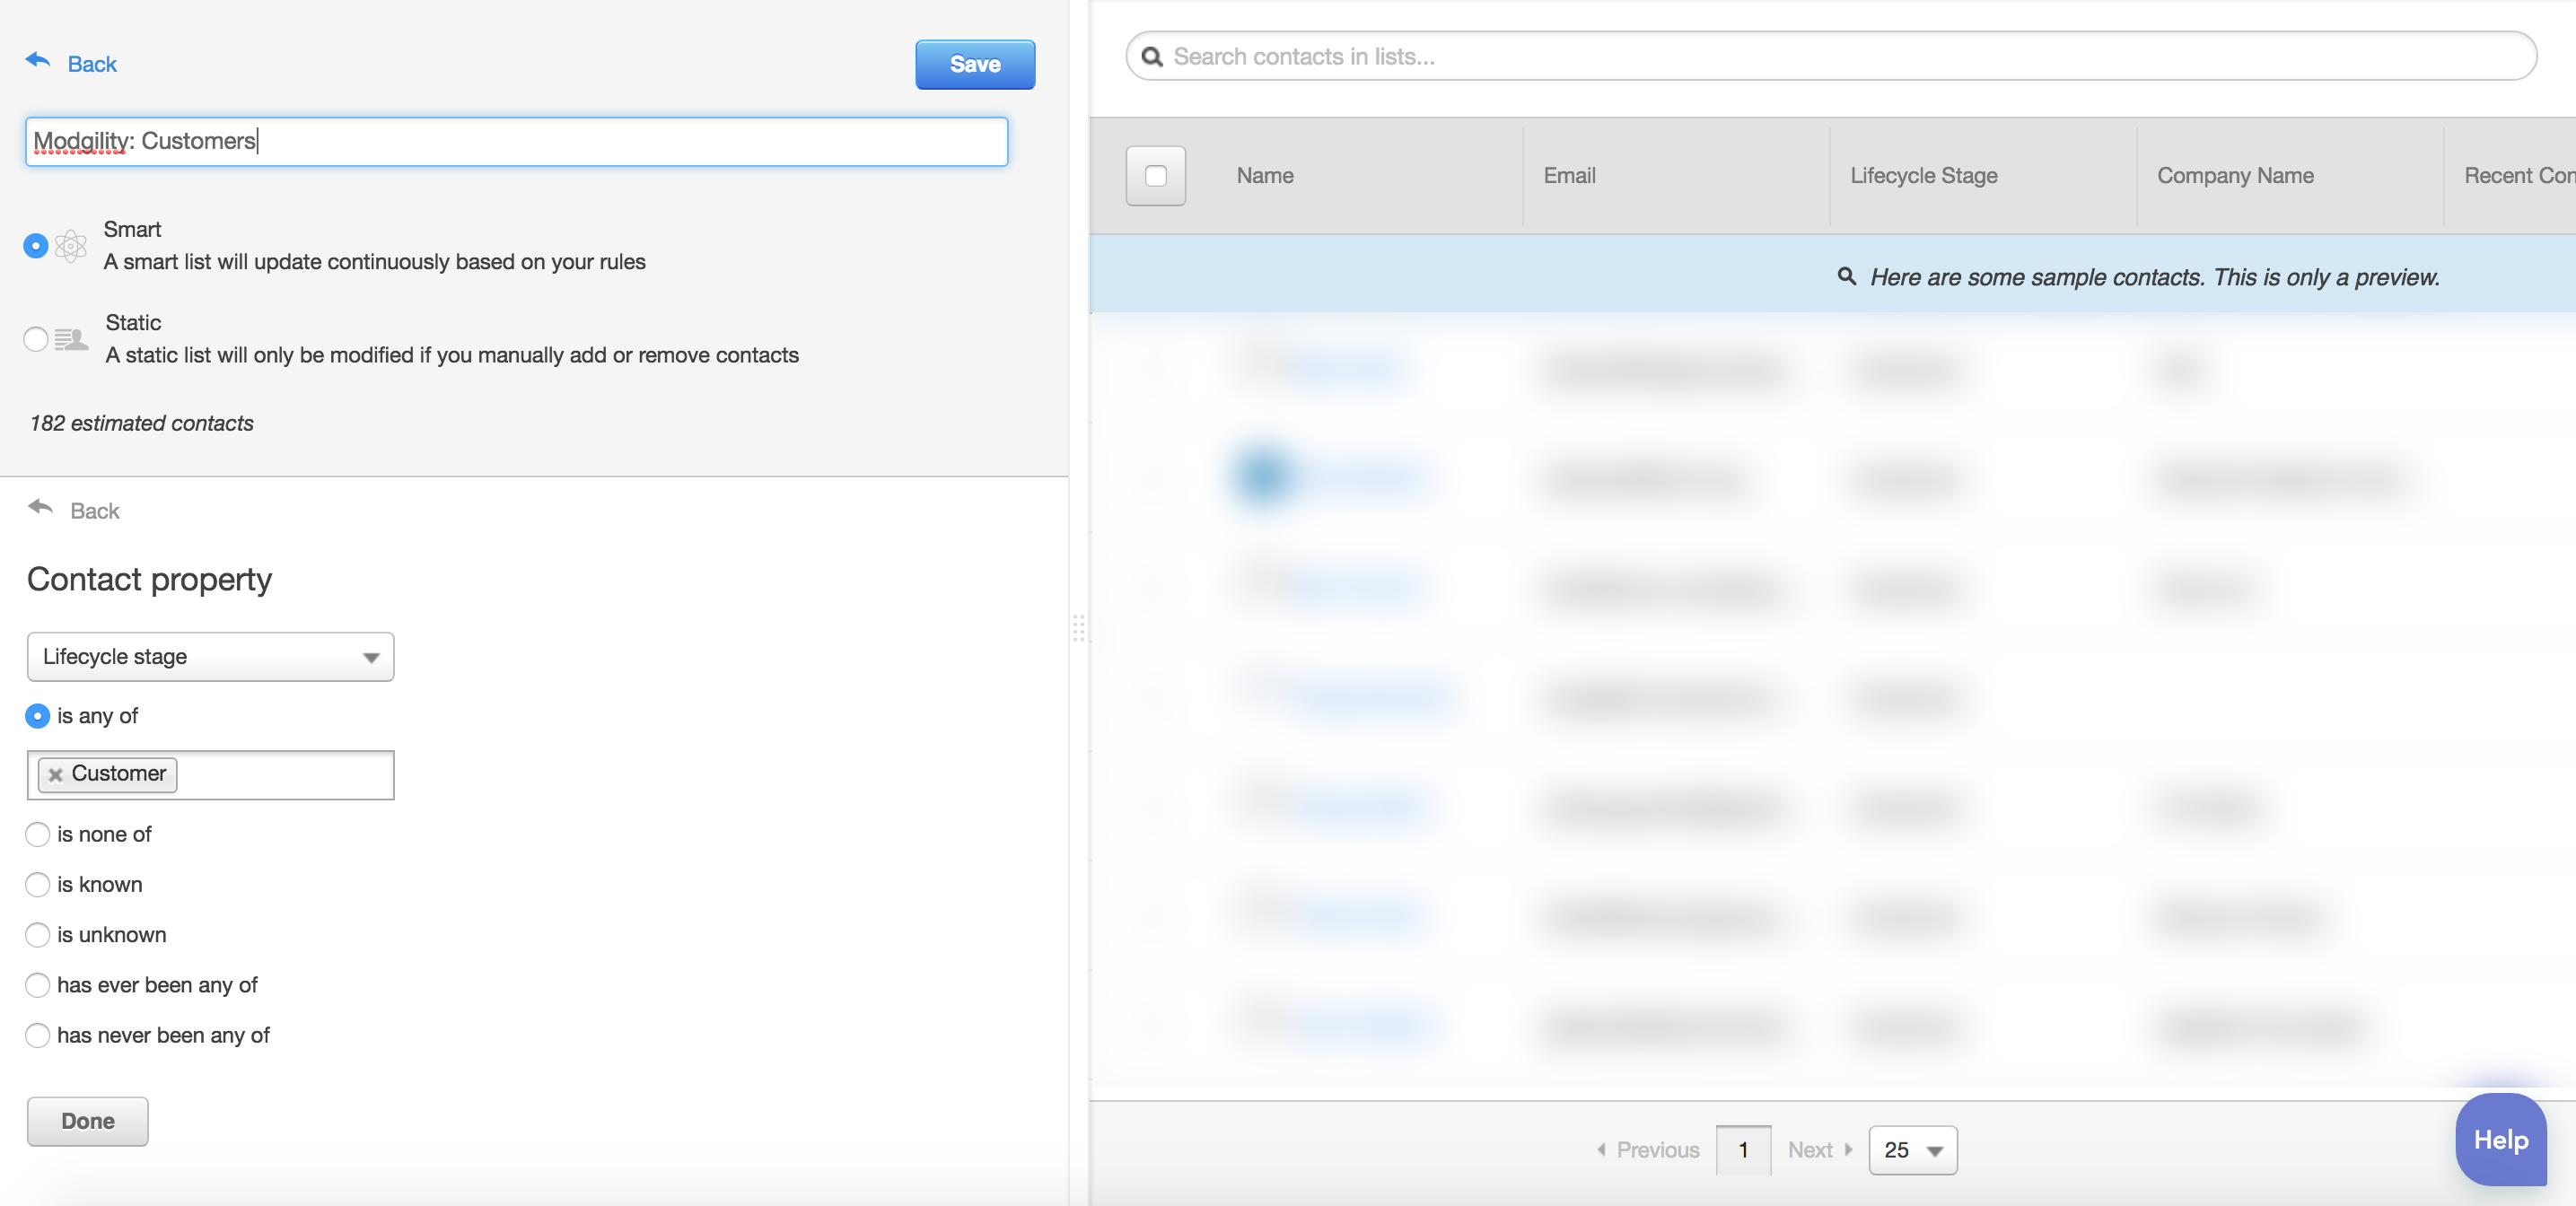
For those of you familiar with HubSpot this should be pretty simple...
Step 1, create a list and name it [Your Company Name]: Customers
All you'll need to do is add a filter for Contact Property > Lifecycle Stage > any of "Customer".
Step 2, create a new report.
Select "Attribution" and then "Frequent Pages Viewed That Generate Leads".
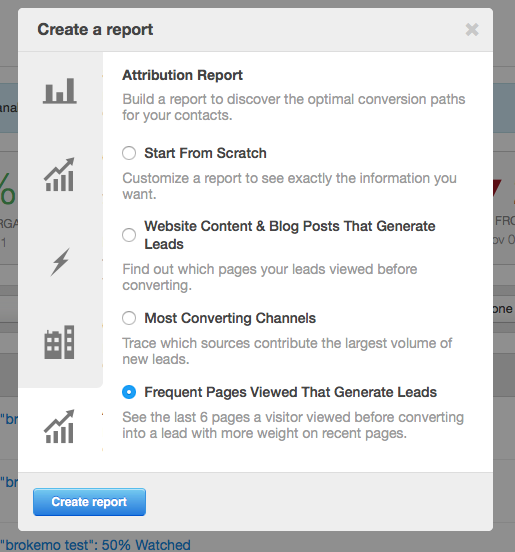
Step 3, edit the report and choose the list you made in step 1.
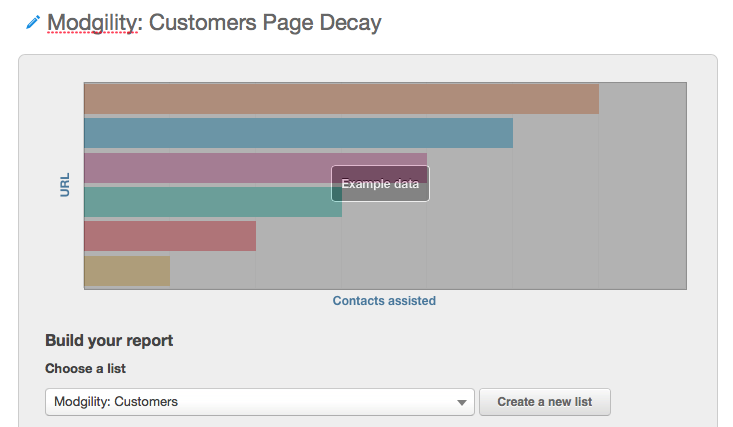
Now you'll be able to see your results...
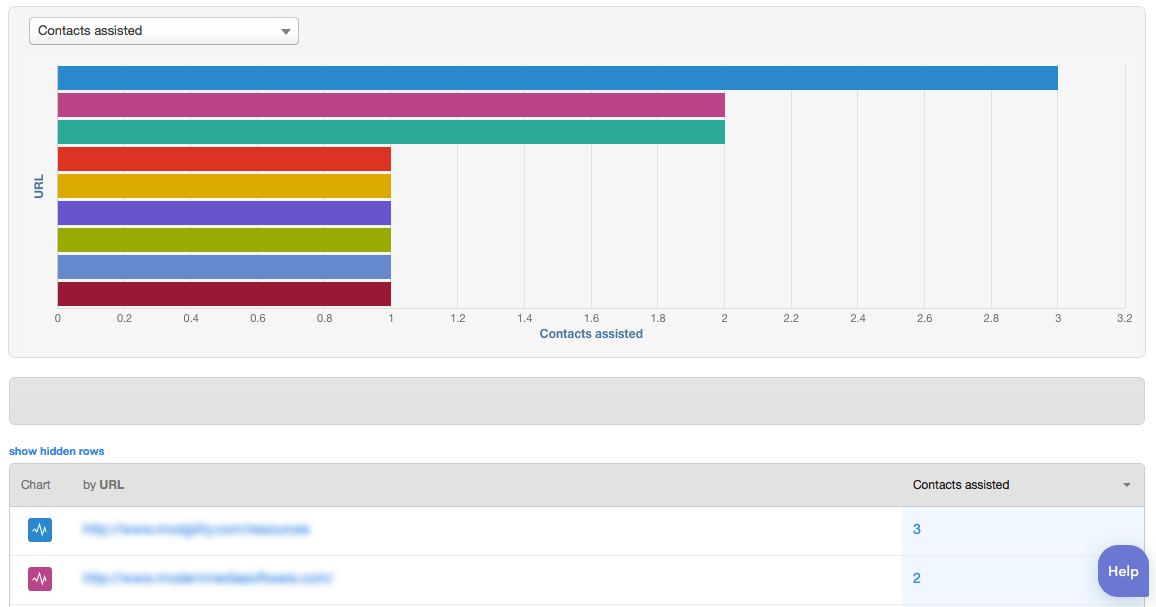
In this example, these results show there isn't one page or offer that generates the most customers.
But, that doesn't mean your business won't have one.
It's an easy report to create that can provide you with a ton of value.
Chapter 2
Improving SEO With Marketing Analytics
You'll be able to prove the ROI of your SEO efforts with these metrics...
Keyword Performance & Ranking: How your web pages rank in search engines for desired search terms
Organic Search Traffic: Unique visitors who arrive at your site from search engines
Branded vs Non-Branded Search Traffic: Organic search traffic includes brand-related keywords and generic keywords
Unique Search Terms Driving Traffic: List of search phrases that visitors use to find your site
Inbound Links: The number of links back to your site from other sites on the web
Conversion Rates from Organic Search: Visitors who arrived at your site through organic search and became a lead
Establish Benchmarks
The first step towards improvement is establishing baseline SEO metrics, which you can do by finding out:
- What percentage of your website traffic comes from organic search?
- The conversion rate of your organic traffic into leads & customers?
- Which non-branded keyword phrases drive the most organic traffic to your website?
- Your listing position in the search engine results pages (SERPS) for keyword phrases for which you want to rank?
- How many inbound links you have, and to what pages on your website they point?
Unique Search Terms Driving Traffic
For example, you may find that the term ‘unicorn shoes’ – for which you rank in listing position nine in the SERPs -- drove less traffic than the term ‘unicorn hats.’
But the traffic that came to your site on the search term ‘unicorn shoes’ actually generated five new customers for your business last month, while the traffic that came to your site for the term ‘unicorn hats’ has led to no customers.
With this information, you should spend more time creating content and building inbound links around the term ‘unicorn shoes’ to improve your listing position in the SERPs for the term. This will increase the amount of qualified traffic that comes to your site for that term.
Identify Holes in Your Content Strategy
Now that you understand what content you have, you start looking at the content that is missing.
If a search term is generating a lot of organic traffic to your website, for example, but none of that traffic converts into leads, it’s an indication that your marketing offer is insufficient (or nonexistent!)
You might notice a related keyword to your product or service that you want to generate traffic from but aren't.
Or, you might be missing a piece of content for a certain part of the buyer's journey.
Remedy this by creating or updating your content to better than the content that currently exists for that SERP.
One way to do that -- develop 10x content.
This tie's into content strategy, but here's the idea behind 10x content...
"10x content, this is the idea that, because of content saturation, content overload, the idea that there's just so much in our streams and standing out is so hard, we can't just say, "Hey, I want to be as good as the top 10 people in the search results for this particular keyword term or phrase." We have to say, "How can I create something 10 times better than what any of these folks are currently doing?" That's how we stand out."
If that doesn't sound hard, I can assure you that it is.
Rand Fishkin, address how to get started creating 10x content in this Whiteboard Friday...
Monitor Your Position
Finally, it’s important to monitor your listing position for the terms that you’re currently driving traffic for.
You not only want to monitor the keywords you want to improve on, but the ones that are high volume, high competition that you are currently ranking well for.
You'd hate for a competitor to take over your spot in the SERPs.
There are plenty of tools that can help you do this.
HubSpot does have the tools you need, but I've found Moz and SEMrush to be more robust since that's all they do.
Let's take a look at what you can do inside SEMrush to help you monitor your position.
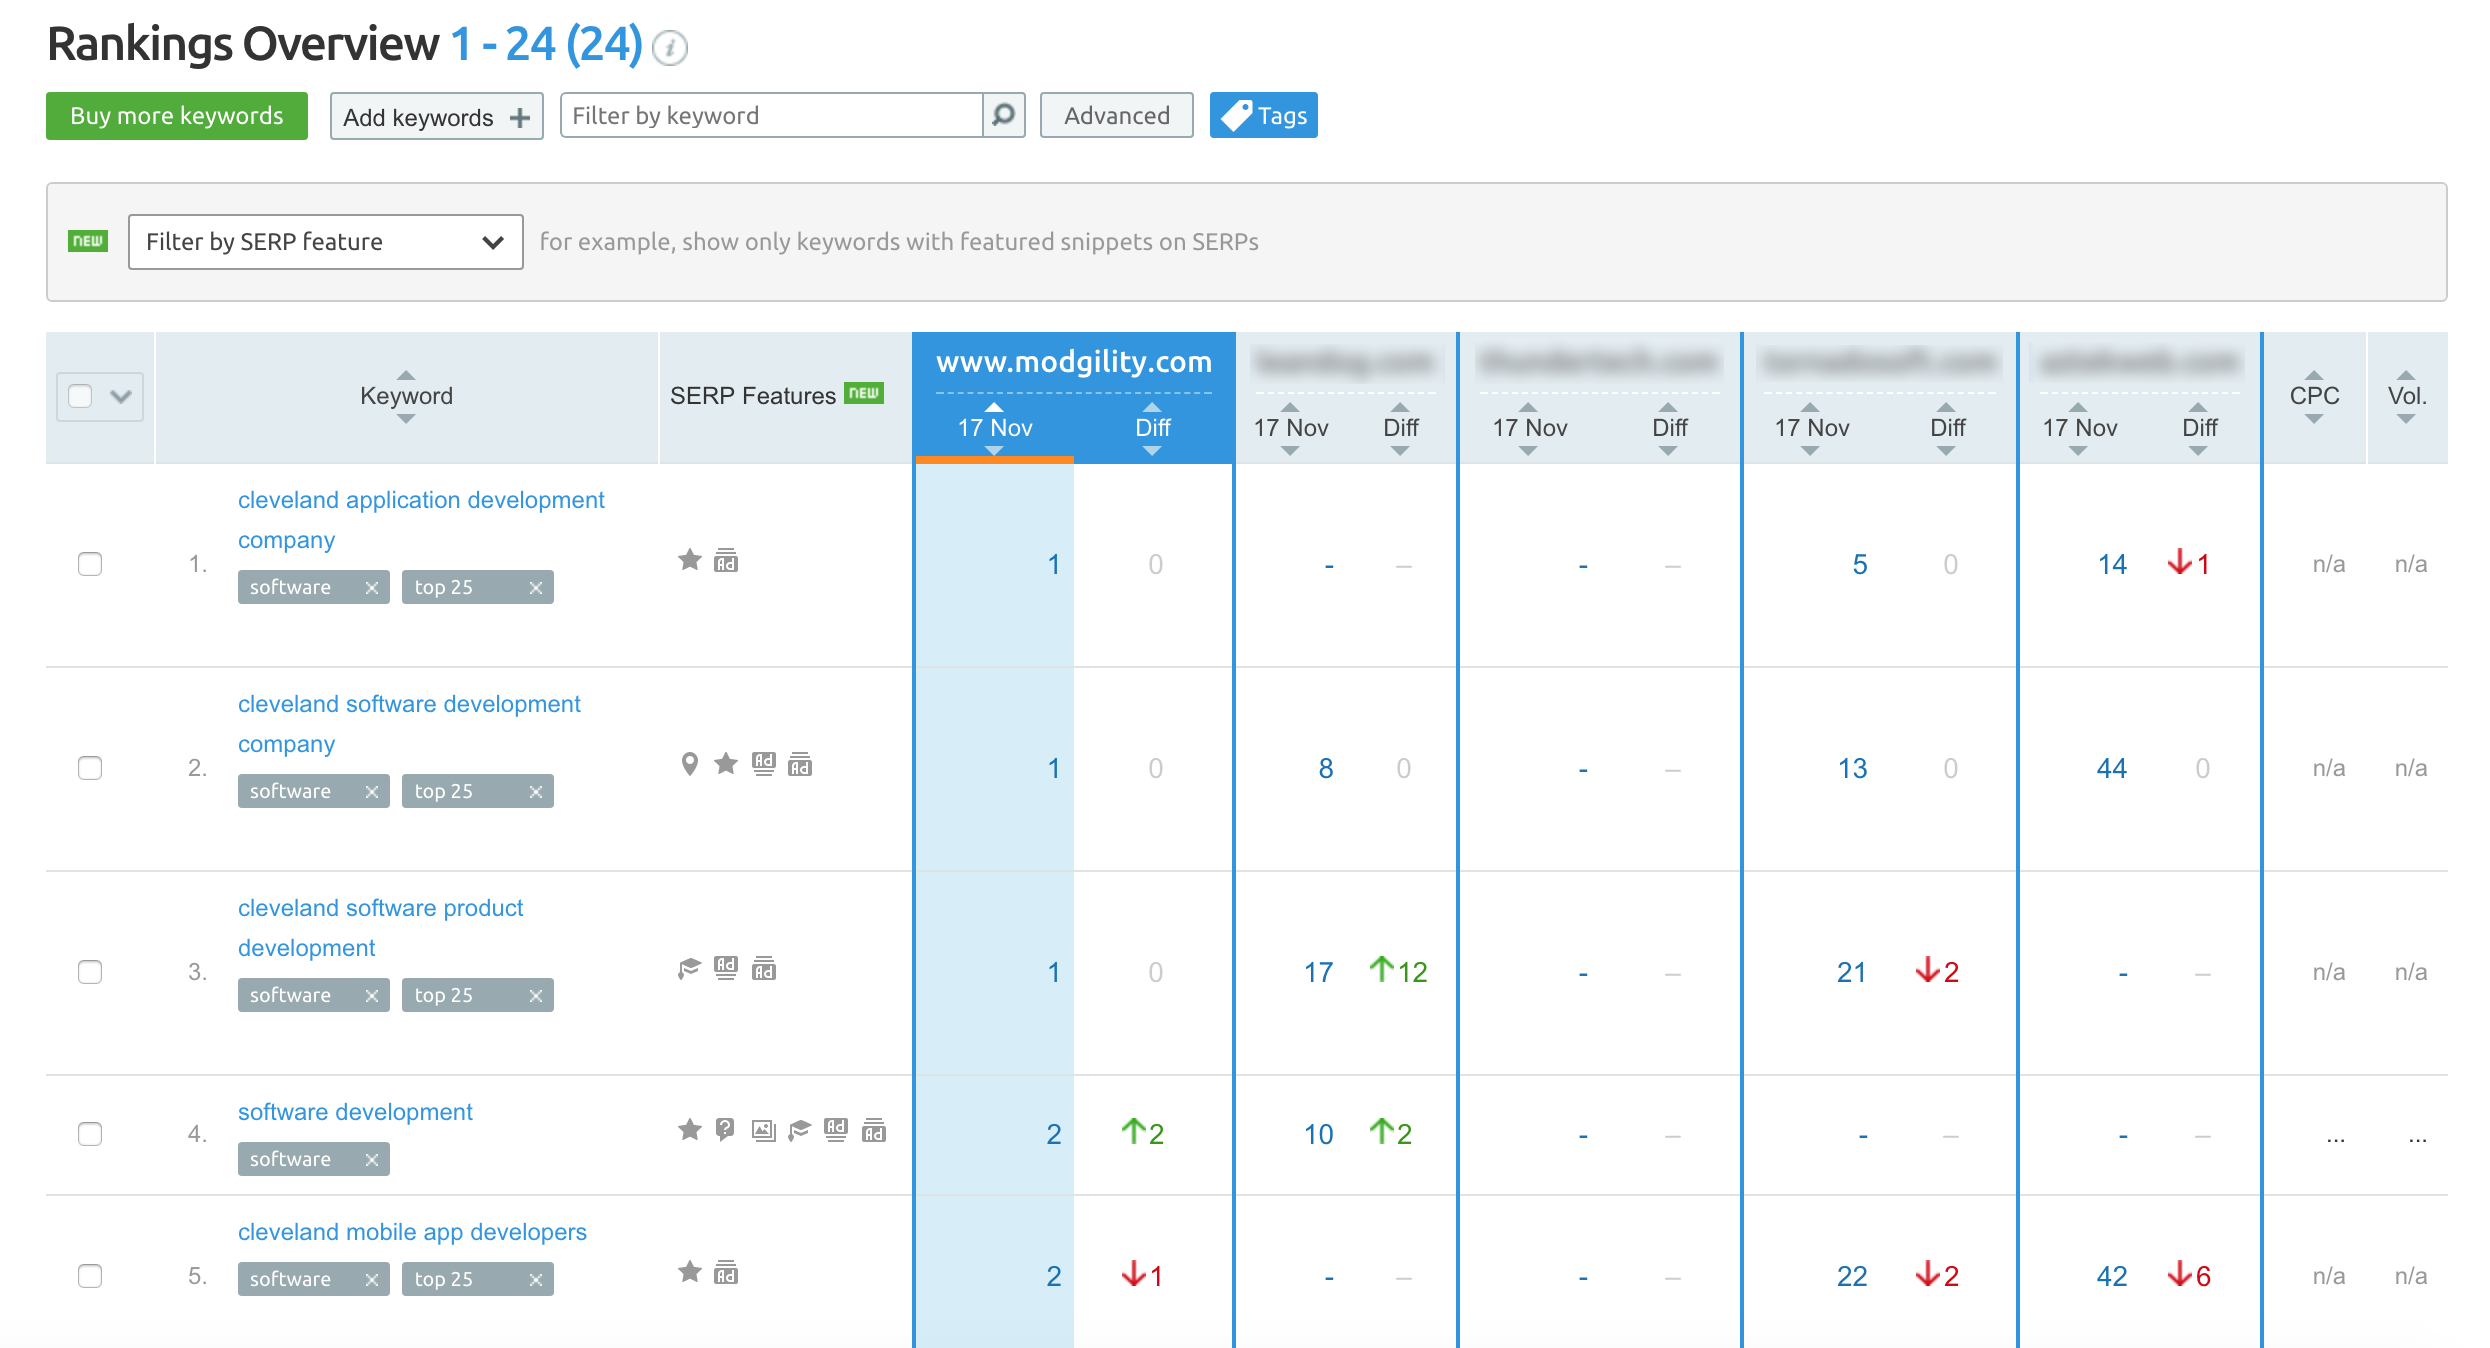
Using SEMrush's position tracking you can monitor your search visibility as well as your competitors...
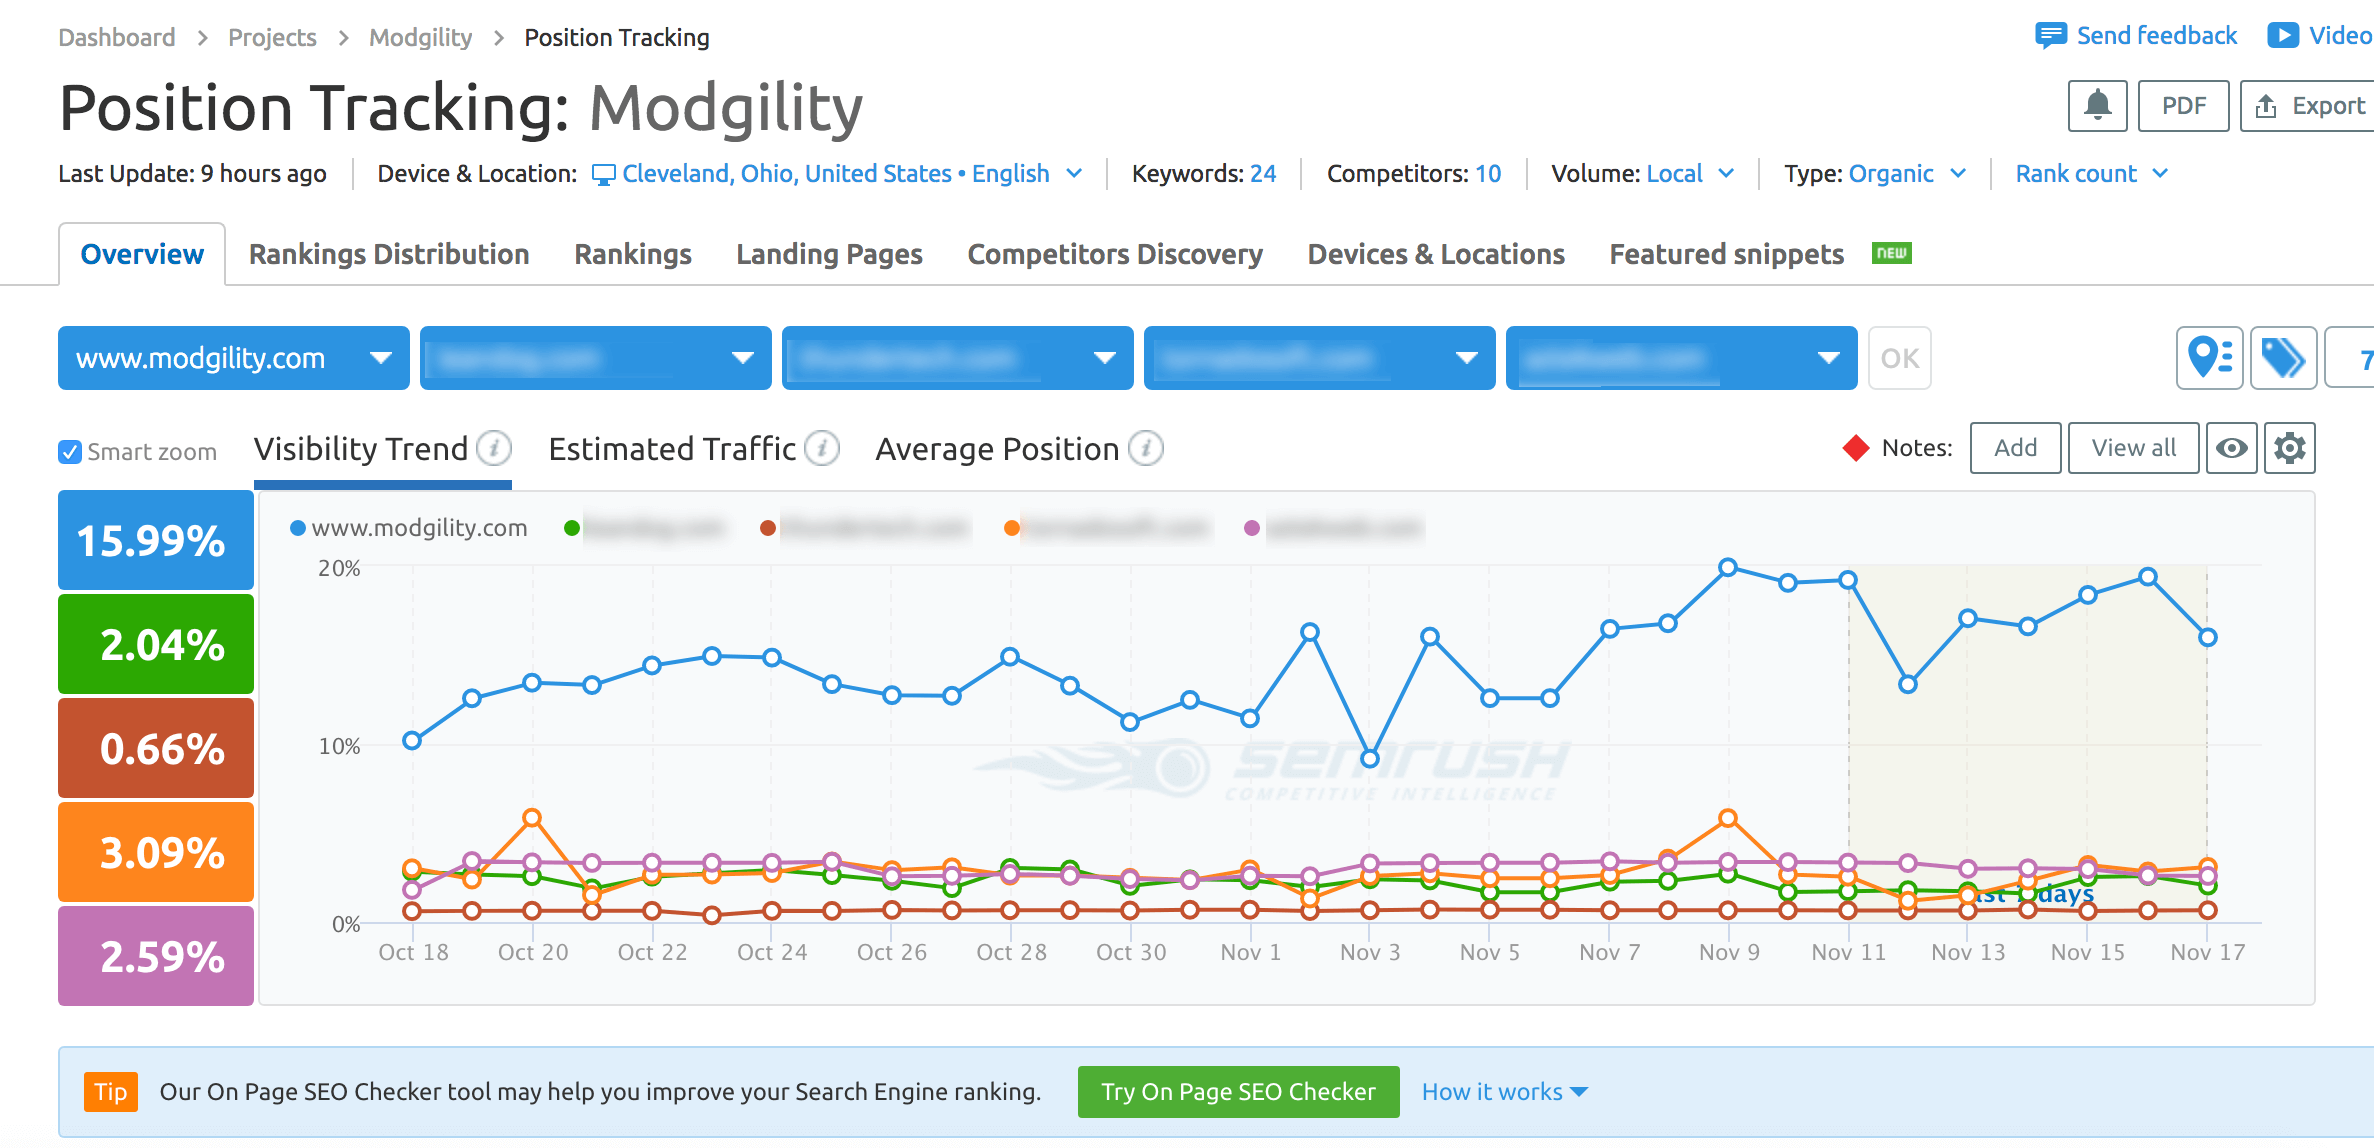
You will also be able to see the exact position you and your competitors rank for keywords based on a Device & Location selected...
Chapter 3
Improving Business Blogging with Marketing Analytics
Here are the business blogging metrics you'll need to measure...
Individual Post Views: How many views each blog post receives
Blog Traffic & Referral Sources: How much traffic you’re generating to your blog and where that traffic is coming from
Call-to-Action Performance: How effective your blog’s individual calls-to-action (CTAs) are at converting blog visitors into leads
Blog Leads: Leads generated that can be attributed to your blog
Visitor-to-Lead Conversion Rate: The rate at which your blog is converting visitors into leads
Individual Post Views
Start by exporting your blog posts, grouping articles by topic, and analyzing the views for each individual blog post.
Here's how to do it...
Have you ever heard the so called “rule of 80 vs 20”?
It was born as an economical and financial rule by Vilfredo Pareto while observing the economical dynamics of Italy and it simply said that “most of the results in any situation are determined by a small number of causes” (Wikipedia).
In plain English, it's the concept that 20% of the inputs are responsible for 80% of the output.
So...
If we apply that logic to our blog, we can assume that 20% of our blog posts are generating 80% of our blog traffic.
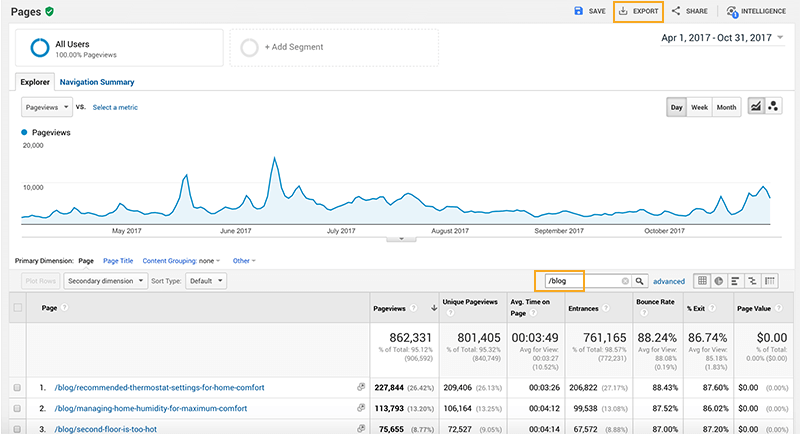
To find these posts go to your Google Analytics, look at Behavior and all pages.
Expand your rows to reflect the number of blog posts you have.
Set your time frame for the last 6-months.
If you don't have a blog view set up that's fine, all you need to do is type "/blog" in to your search as long as that's how your URLs are structured.
Then export, choose a Google Sheet or Excel file.
Open up your sheet and go to the tab labeled Dataset 1 and scroll to the bottom.
The second column will be total page views, take that number and multiply it by 0.8. That will give you the number of page views for 80% of your blog traffic.

Scroll back to the top of your sheet and start adding post views until you hit that number.
I wouldn't recommend going down the list 1 by 1 and adding it up.
I'd start about 20% of the way down and take the sum of those.
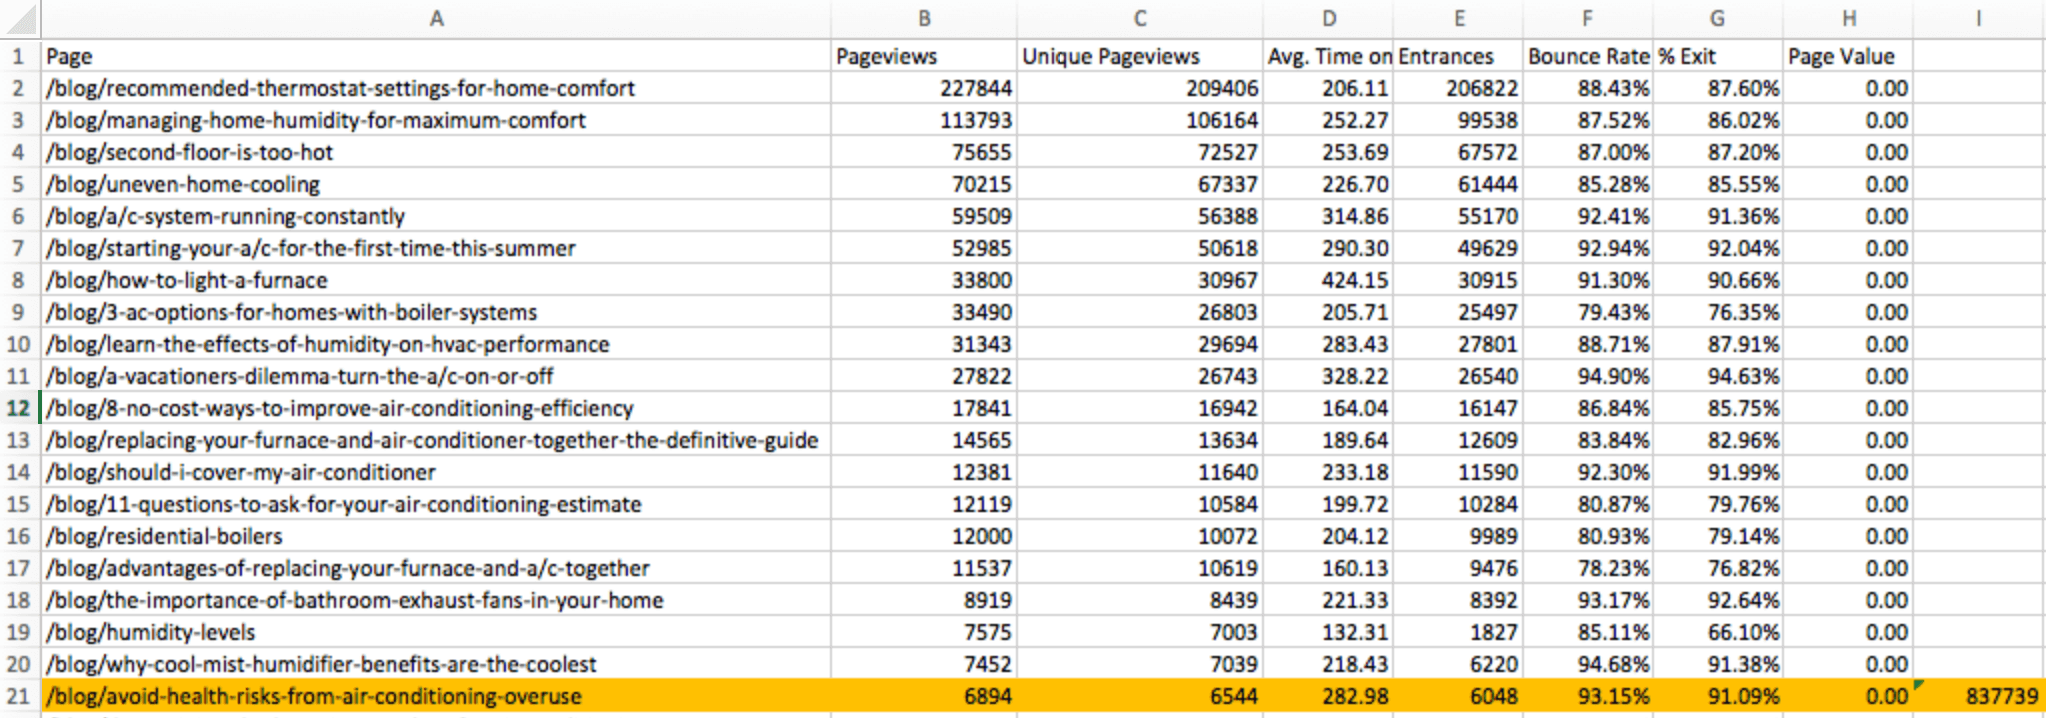
You'll notice this particular client has a top page that generates a ton of traffic!
That means our starting point of 20% of the way down accounts for too much traffic.
If you are in a situation like this, I would almost recommend excluding that dominate post from your traffic list, but note it's topic and format.
Now that you've identified the top 20% of you content, ask yourself...
Are there certain topics that perform better than others?
Topics that receive more post views should receive more emphasis in your content creation.
The next question you need to ask is this...
Do certain posts receive more inbound links than others?
To see that information in it's simplest form go to your Google Search Console and check Search Traffic > Links to Your Site and you'll see a list like this...
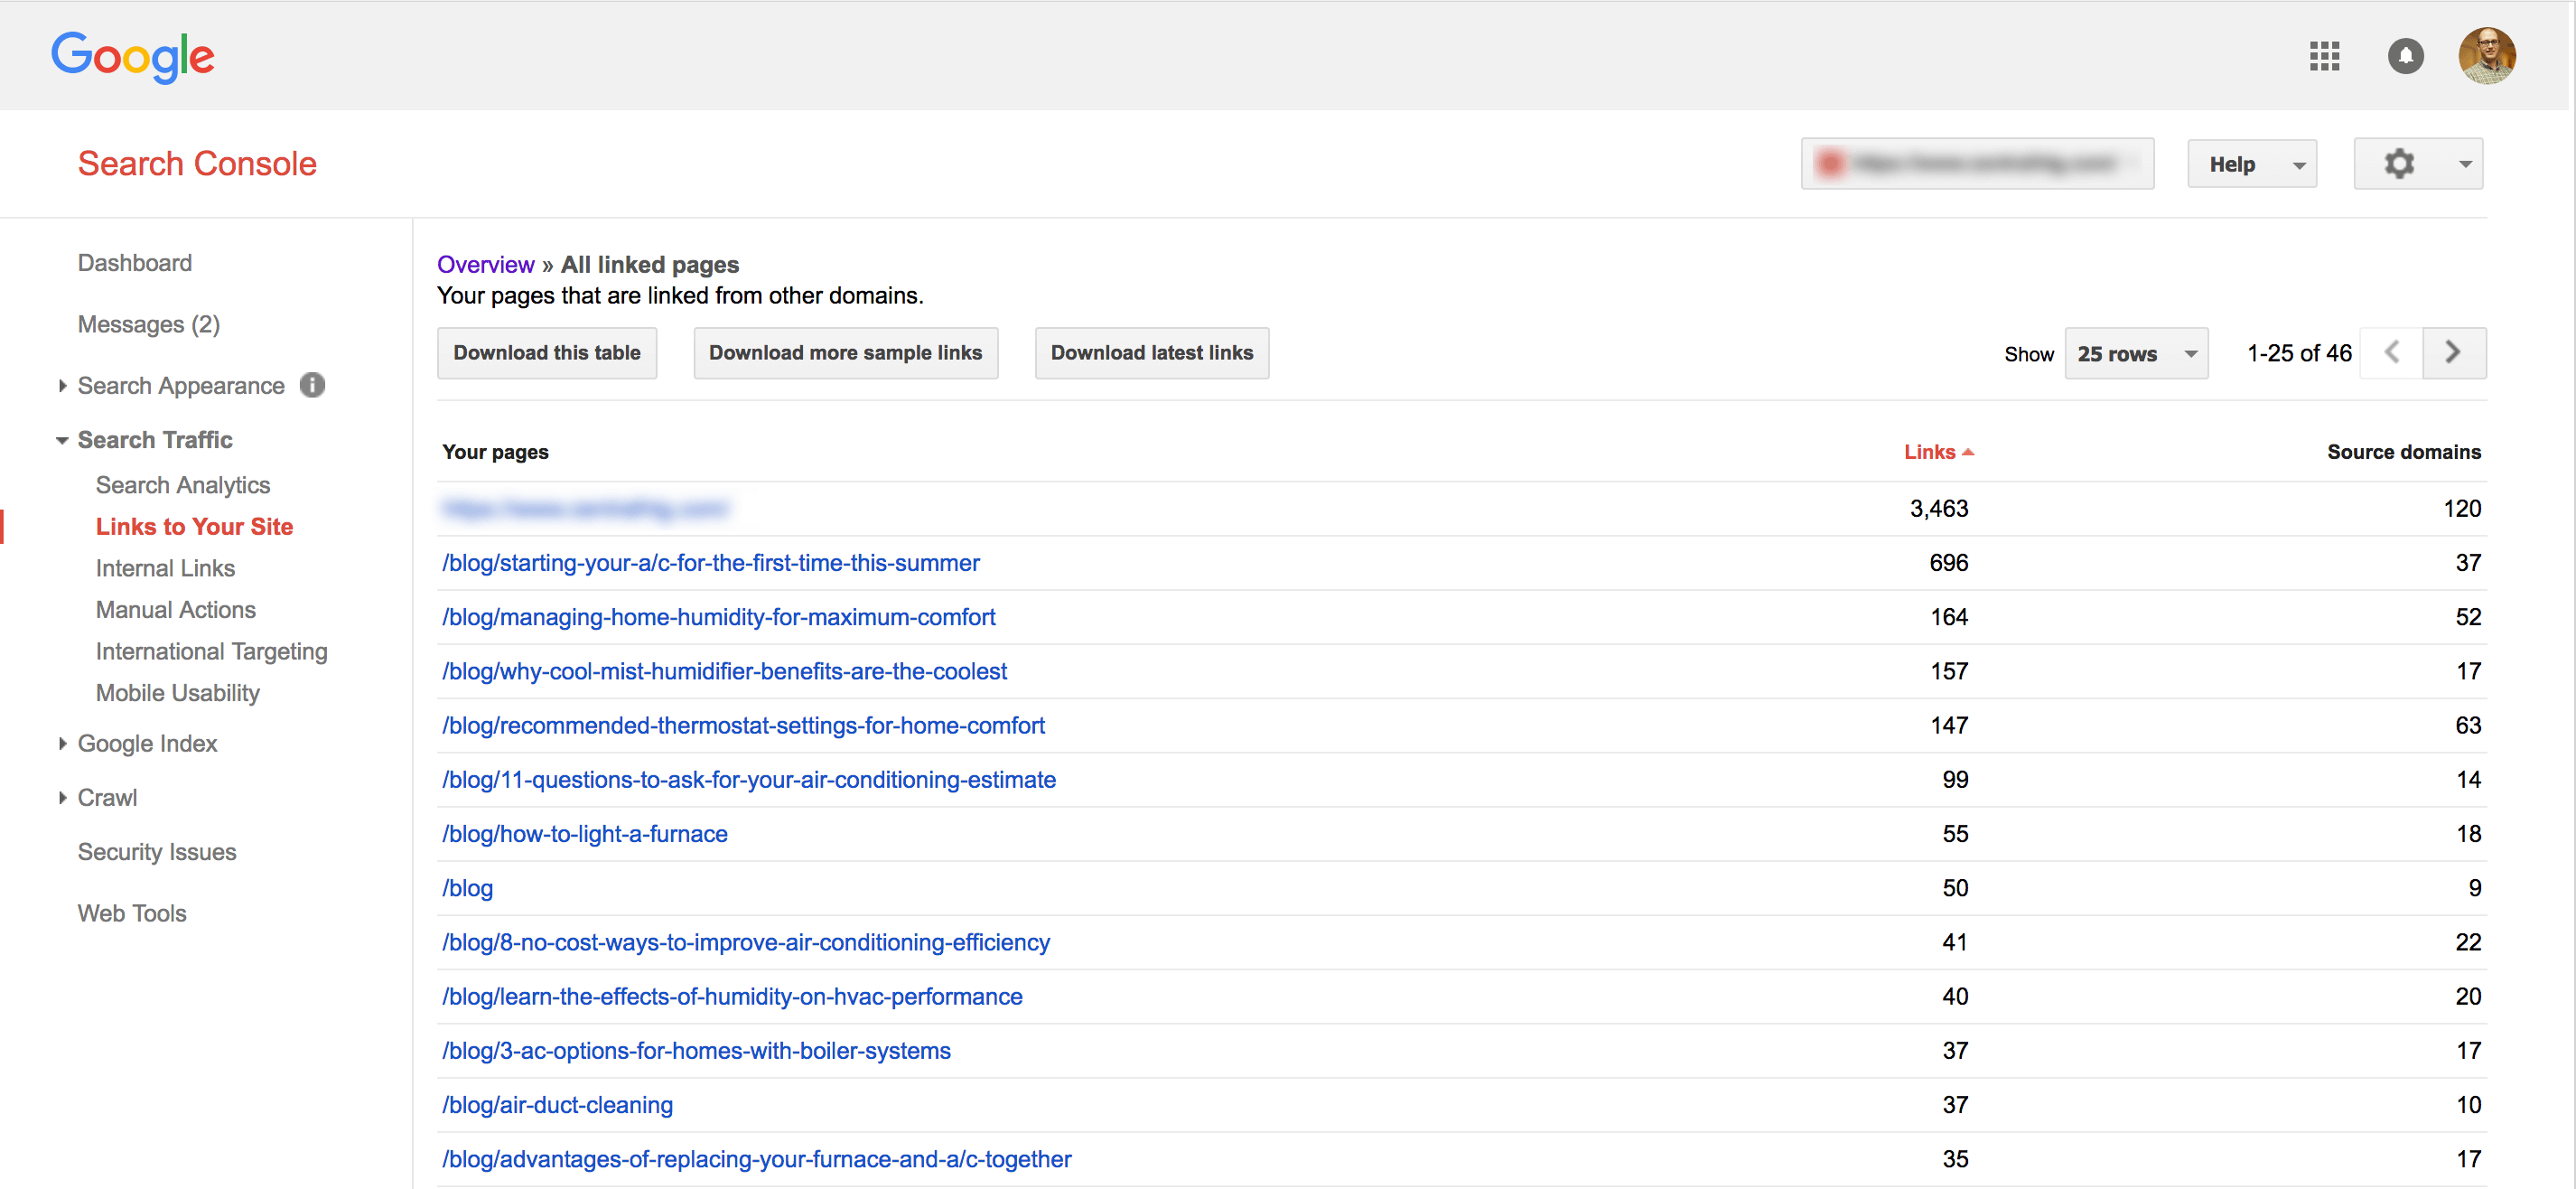
However, not all links are created equal.
If you want to take your link auditing to the next level, which I would recommend, you'll want to use something like ahrefs.
That will allow you to see where the link is coming from, what the websites domain rating is, and what the URLs rating is.
Traffic and Referral Sources
Analyzing where the traffic to your blog comes from is the easiest way to improve blog content promotion and distribution for more traffic.
After all, if you know where people are finding your blog (and where they aren’t), you know where to focus your efforts.
If very little traffic to your blog comes from organic search, for example, you know you need to spend more time optimizing your blog content and getting inbound links.
By conducting a link audit of your site, you may also find there are sites you did not realize were referring traffic to your blog.
Next take a look at social media channels that drive traffic.
You may assume your biggest traffic drives are Twitter, Facebook, or LinkedIn, but perhaps it’s actually Pinterest.
A channel you haven’t put much effort into.
Knowing this, you can focus more effort promoting content on Pinterest to increase blog traffic.
The next step will be to look at sources for leads and customers.
By looking at the sources and offers that traditionally brought in new customers for your organization, you will be able to identify the behavior you need to engage in, to qualify leads and push them down the sales funnel.
Closed-loop marketing directs your attention to the most powerful conversion events and channels.
Call-to-Action Performance
The performance of your blog’s lead generation is directly impacted by your call-to-action performance.
To improve your blog’s call-to-action performance, analyze the CTA click-through rate.
If you have a low click-through rate, there are three places you can make improvements:
1. Make a More Compelling Offer
If what you offer is not enticing enough to get clicks, then don’t expect to collect many landing page conversions.
2. Create an Offer that Better Aligns with Your Blog Post
If your offer isn’t relevant to the topic of the blog, it probably isn’t enticing to the reader.
3. Split Test the CTA Copy & Design
The copy may be confusing, too indirect, or not clearly conveying the value of the offer. The design of your CTA may blend into the page too much. Alternatively, your visitors may be suffering from banner blindness if your CTA looks too much like an ad.
The first two improvements will most likely have the largest impact on whether or not your content offer generates leads, simply because if it's irrelevant your audience won't want it.
However, let's take a look at the third area of improvement - split testing.
A common best practice for blog posts has been to place your offer at the bottom of the post with a design that really pops.
After looking at a client's blog post CTA performance and determining that it was the most relevant offer possible, I decided to do a split test on the CTA placement.
Why, you ask...
Visitors weren't making it all the way through the posts.
If you are writing longer posts, which our client was doing, the less likely visitors will be to make it to the bottom.
Thus, decreasing the visibility of the CTA.
Without updating the design, the CTA was placed higher up in the post at a logical break point.
Ending up with this...
The CTA got a click-through rate of 0.37%...
Not exactly fantastic.
The next treatment I wanted to test was for banner blindness.
As a marketing blog, the audience is pretty savvy, so they might be burnt out on all these image CTAs.
We ended up with this...
The click-through rate on this CTA was 4.71%...
That is pretty fantastic.
Switching the design to be text based, instead of graphic based, resulted in a 1,172% increase in click-through rate.
This may or may not work for your blog, but the point is to test.
Blog Leads
Now that your blog’s calls-to-action are optimized, see how many leads you generate from your blog every month compared to your other lead generation channels.
Knowing how much of a direct role your blog plays in lead generation will help you prioritize marketing efforts.
If you created a "Frequent Pages Viewed That Generate Leads" from earlier, you can use that report to see which blog posts are contributing to leads and customers as well.
Visitor-to-Lead Conversion Rate
You’ll want to analyze more than just number of new leads from your blog, though.
Drill down into your blog’s visit-to-lead conversion rate to see how effective you are at converting blog traffic into leads.
Do you have low traffic, but a high conversion rate?
Then you know you should put more effort into generating traffic to your blog.
Leads into Customers
Finally, use your closed-loop analytics to analyze how effectively your blog leads convert into customers.
Just as the number of leads generated helps you prioritize your marketing channels, the rate at which blog leads turn into customers should help you prioritize, too.
For example, if your blog generates leads that convert into customers at a higher rate than, say, social media does, it’s more efficient to put more time into creating blog content, and use social media to promote your blog content.
Chapter 4
Improving Social Media With Marketing Analytics
Social media metrics you'll need to measure ROI...
Social Media Engagement: The number of interactions generated in social media channels
Traffic from Social Media: The percentage of unique visitors to your website that comes from social media
Conversion Rate from Social Media: The percentage of visitors from social media that convert into leads or customers
Social Media Engagement
If you haven’t noticed, there are a lot of social media networks that are constantly updating features and layouts.
Applying marketing analytics to your social media is crucial to help you prioritize on what sites you should spend time.
Take a look at your social media reach, as measured by metrics such as Facebook “Likes,” retweets and @replies on Twitter, blog comments, Facebook page comments, YouTube video views, and content embeds.
Looking at metrics like this will tell you where your audience is.
That's the channel to put your focus in.
Traffic from Social Media
Begin by looking at which social media sites send traffic to your website. This will help you establish which sites you should allocate the most time and resources.
Social media is also often a huge traffic generator for business blogs and landing pages, likely two of your big lead generators.
Use your closed-loop analytics to determine how much of that social media traffic turns into leads, and which sites provide the best visitor-to-lead conversion rate.
Not getting any social media traffic?
There are plenty of reasons for that.
In fact, if you want to read about 10 of the most common take a look at this.
The problem that you can fix with your social media posting right now is ...
Create custom images.
Don't share your content with a boring image.
Want to do a product promotion?
Create a custom image, not just an image of your product that you'd see on an Amazon page.
Maybe you want to share an inspirational quote, use a custom image for that too.
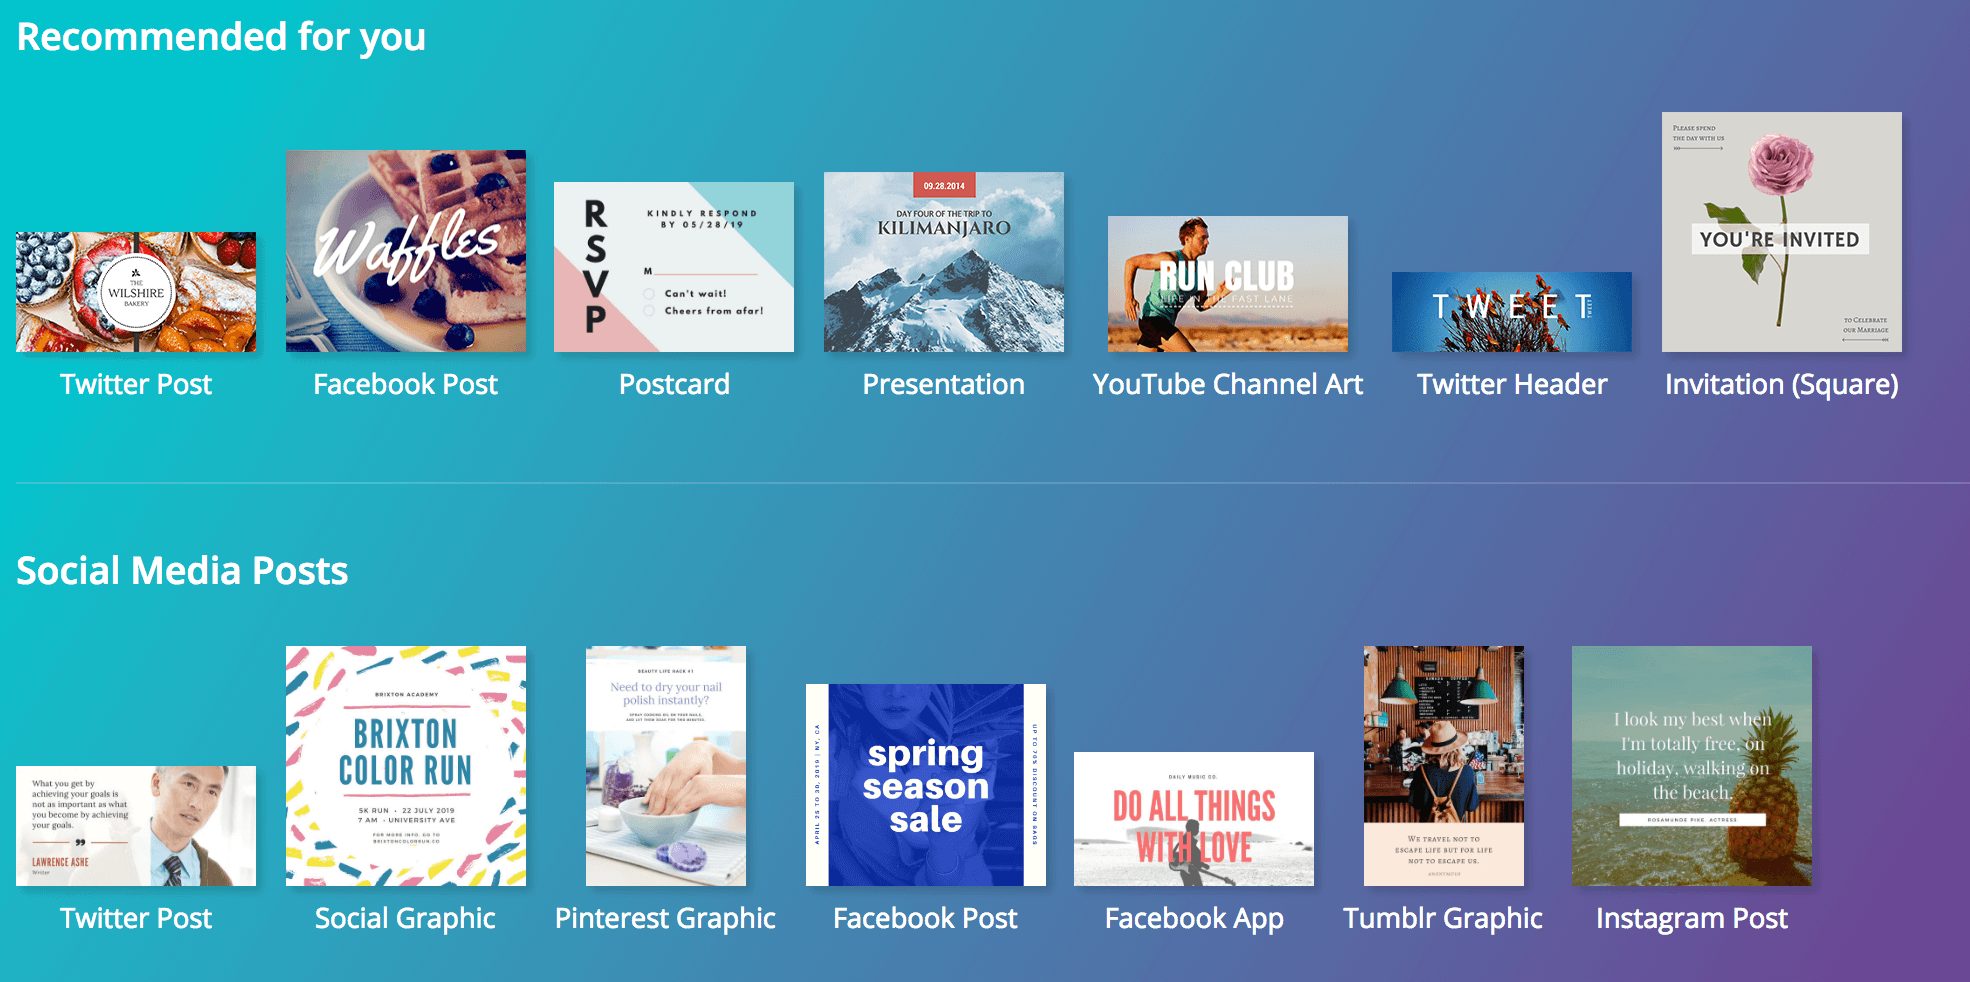
The good news is that Canva exists.
Canva makes it easy to create social media images for each social sharing platform.
Conversion Rate
Take it one step further and analyze which sites have the highest lead-to-customer rate.
Leads are great, but customers are better!
Looking at your closed-loop data, with how engaged your followers are from each social media network, can help you learn what kind of content resonates with your social media followers, too.
Taking a granular approach to your analytics will guide you in choosing the right social media channels to focus on and optimize for customer acquisition.
Perhaps you notice that traffic from LinkedIn doesn’t seem to like your blog content – there’s low engagement, and a low visitor-to-lead conversion rate on blog offers.
But they share and comment on your product-related LinkedIn content, and have a high visitor-to-lead rate on product related offers.
This is a good indication that your LinkedIn fans are further down the sales funnel than your followers on other social media networks.
Use that information to tailor the content you publish to each network accordingly and increase your visitor-to-lead and visitor-to-customer conversion rate for each social channel.
Chapter 5
Improving Email With Marketing Analytics
To get the most out of your email you'll want to measure these metrics...
Bounce Rate: The percentage of total emails sent that could not be delivered to the recipient’s inbox
Delivery Rate: The percentage of emails that were actually delivered to recipients’ inboxes
List Growth Rate: A measurement of how fast your email list is growing
Click-Through Rate: The proportion of the audience who clicked on one or more links contained in an email message
Conversion Rate: The percentage of recipients who clicked on a link within an email and completed a desired action
Revenue Per Email Sent: Measuring the email’s return on investment
Bounce & Delivery Rate
Of all your email marketing analytics, your bounce and delivery rate are two of the most crucial to measure.
A high hard bounce rate or a low overall delivery rate is often a symptom of an unhealthy email marketing program.
Your email deliverability rate could be impacted by:
- Your email sending reputation
- The health of your email list
- The value of your content
- How well segmented your email list is
A poor sender reputation, scored by many ISPs using the free service by Return Path called Sender Score, is crucial to email deliverability.
“83% of the time an email is not delivered to an inbox, it is because of a poor sender reputation.”
If you are experiencing a high hard bounce rate, immediately remove all of the email addresses that have bounced from your list to prevent gaining a reputation as an email spammer and harming your email deliverability.
Your email delivery rate should always stay at 95% or higher.
If it is lower than this or you find one month it slips below 95%, use this opportunity to scrub your list of the following contacts to decrease your bounce rate and increase your deliverability rate:
- Duplicate and invalid email addresses
- Contacts who haven’t opted-in
- Alias email addresses
- Email addresses that hard bounce
- Completely disengaged email recipients
If you find just one particular campaign has a lower than average delivery rate, it doesn’t mean the entire list segment should be deleted.
Instead, examine the content of the email to see if there was an accidental indication to SPAM filters or ISPs that your message should be blocked.
List Growth Rate
Now that your email marketing program is healthy again, you may notice the size of your list has seriously decreased.
The average email marketing list decrease at a rate of 25% a year.
That's a good thing.
It'll keep your email list healthy and deliverability rates high.
Take a look at your list growth rate, though, to ensure you’re continuing to add new contacts to that list for nurturing.
If your list growth rate is low, you will want to do at least 1 of the following:
More Top-of-the-Funnel Offers - You need more compelling offers that drive visitors to fill out a form and opt-in to your email communications.
More Traffic to Existing Offers - You have compelling offers, you just need to drive more traffic to those pages through content creation, better calls-to-action, and social media marketing.
More Optimized Pages - You need to improve the visitor-to-lead conversion rate on your landing pages to better capture the traffic you’re driving.
Click-Through Rate
You may notice open-rate hasn’t been included as a measurement for your email marketing effectiveness.
Click-through rate is a far more accurate indication of how well your email content resonates with your audience, as open-rate is often misreported based on how each individual email client calculates an “open.”
If you have a high click-through rate for a campaign, you know the offer was compelling, aligned with the content in the email, and matched the interests of that particular list segment.
Naturally, you should expect to see lower click-through rates on offers with a higher barrier to entry.
For example, if the offer in your email prompts your recipient to purchase something, you’ll receive fewer clicks than if your offer is to download a free content asset.
When analyzing whether your click-through rate for a campaign is good, compare it to the click-through rate of other email offers of that type.
Here are three different ways you can improve your email click-through rates:
1. List Segmentation
The better segmented your email list, the more targeted your email offer. eConsultancy reports that marketers who segment their list have 24% more sales leads, 18% more transactions, and 15% greater customer acquisition.
2. Optimize the Email & Landing Page
A/B test the layout and copy in your email offer. Email recipients scan emails, so your offer should be above the fold, visually bold, and written with action-oriented copy. You can also add a sense of urgency by adding a time frame during which the recipient must redeem the offer.
3. Email Sharing Options
Including social sharing options in email enables you to increase the email sharing and forward rate. Emails with only one social sharing option have a 30% higher click-through rate than emails without any social sharing options. Those with three or more have a 55% higher click-through rate. This is a quick addition to your emails, and helps you grow your email list while improving click-through rates and engagement.
Conversion Rate
Like a call-to-action, a high email click-through rate is only really helpful if you also have a high conversion rate on the landing page to which your email links.
The conversion rate of your email campaign relies on having a well-optimized landing page, which can be difficult if you’re pointing email recipients to a generic landing page instead of one messaged according to each individual list segment.
Message match is key.
For example, perhaps you have an offer and landing page for a webinar about unicorn grooming, and you send an email campaign promoting that offer.
That email campaign might go to two different list segments – unicorns interested in learning new hair styles, and unicorn groomers interested in learning how to give their unicorns new hair styles.
You’d message those emails differently, and you should message the landing page for the webinar differently, too.
If you have a high email click-through rate but a low overall conversion rate for an email campaign, it could be due to this type of disjointed messaging between email and offer content and landing page content.
Remember...
One landing page, one purpose.
Revenue Per Email Sent
If you are using email marketing for direct sales, you should use closed-loop analytics to attribute revenue to email marketing campaigns.
To do this, you must integrate your ESP with your marketing analytics.
You can do this by using a unique tracking URL in all of your email links so you can attribute clicks to a specific email campaign.
If you find that your email marketing isn’t actually driving revenue, perhaps email should be utilized more frequently as a lead nurturing tool to drive re-conversions, not a mechanism for direct sales.
Chapter 6
Improving Lead Nurturing with Marketing Analytics
Measure your lead nurturing with these metrics...
Click-Through Rates: The proportion of the audience who clicked on one or more links contained in a lead nurturing email message
Conversion Rates: The percentage of recipients who clicked on a link within an email and completed a desired action
Time to Customer Conversion: The length of time it takes for a lead to become a customer
Cost Per Customer: The marketing cost of acquiring a new customer
Click-Through Rates
The effectiveness of your lead nurturing is dependent on how well you’ve segmented your leads.
Dive into your analytics to identify any problems with your list segmentation.
Start by looking at your unsubscribe rate, which should stay below 1% at all times.
If it’s higher for any particular list segment, it’s an indication the content you are sending isn’t relevant to that list segment, and they are unsubscribing as a result.
You can glean similar insights by examining the click-through rates of each list segment.
Marketers who suffer a low click-through rate for a particular list segment haven’t aligned their offer well with the recipients on that list.
Fix Poor List Segmentation
Faulty list segmentation can be remedied by revisiting how you’ve mapped content to your list segments based on their stage in the sales cycle.
Deliver email content to leads based on these factors:
- Pages they’ve visited on your site
- The content they’ve downloaded
- The blog posts they’ve commented on
- How far down the sales funnel they are
Conversion Rates
You can optimize the offers you deliver by analyzing which CTAs have the highest click-through rate, and which landing pages have the highest visitor-to-customer conversion rate in your closed-loop analytics.
Time-to-Customer Conversion
You should always be looking for ways to make your lead nurturing more efficient.
To improve your time to customer conversion, analyze how good you are at generating marketing qualified leads (MQLs) with your lead nurturing.
MQLs are the leads that are more likely to become a customer based on their pre-close activities.
If you’ve implemented lead nurturing effectively, more leads should be moving to the MQL stage of the sales funnel.
Analyze this for each lead nurturing campaign. You may find that some list segments move more slowly than others. If you do find that to be the case, it means there is a bottleneck in your lead nurturing or a list segment may not be accurate.
Revisit the content and offers you’re using for that list segment. You may be sending less-than-compelling offers, or pointing leads to under-optimized landing pages.
You can also improve your time to customer conversion by looking at the number of sales-accepted leads in each lead nurturing campaign. Marketing automation should increase not just your number of MQLs, but the number of sales-accepted leads.
If this is not the case…
Meet with your sales organization to diagnose the problem.
This is often a result of misaligned lead scoring criteria between Sales and Marketing. But by fixing it, you should see your time-to-customer conversion rate decrease as Sales reaches out to leads that have reconverted enough to provide the quality information needed to close sales.
Cost Per Customer
Effective lead nurturing converts leads into MQLS and sales accepted leads, but it must follow through all the way to customer.
Use closed-loop analytics to ensure the leads you’re nurturing actually turn into customers, and they do so at an efficient cost.
Over time, your cost per customer should decrease as more leads that typically bleed out of the top of the funnel are adequately nurtured down through the bottom of the funnel – until they are finally converted into a customer.
Check this metric monthly to ensure your lead nurturing efforts stay cost-efficient.
Conclusion
“Be sure you are allocating the most time and resources to the marketing channels with the most ROI”.
You probably noticed none of the actionable improvements you can make by looking at your marketing analytics are possible without closed-loop analytics.
The mistake many marketers make is thinking their end goal is generating leads. It’s not. Your end goal is generating customers. And you have no way of measuring whether you’re doing that, nor how efficient you are at it, without closed-loop analytics.
After analyzing all this data about your blogging, social media, lead nurturing, email marketing, landing pages, and calls-to-action, ask yourself—what marketing channels are the most helpful at generating leads that turn into customers?
Be sure you are allocating the most time and resources to the marketing channels with the most ROI, and constantly monitoring these analytics to see if, over time, some channels start to become more effective for your business.
Curious about inbound for your business? Check us out!